Let’s be honest, if you are utilizing Instagram for business, you have to track your Instagram performance. Just like any other social networking site, you ought to have a system set up on Instagram. A Strategy.
And in order to monitor your progress and execution of that strategy, you need to know how you’re performing.
The best way to do this is to track your Instagram analytics regularly.
While there are a number of options available, I use and recommend Iconosquare. It’s a free platform to use and the only setup required is connecting your Instagram account. After you’ve connected your account, they do all the work for you. And your analytics are updated daily so that you can easily keep track of your information. You can even set up email notifications to receive an alert every time your Instagram analytics are updated.
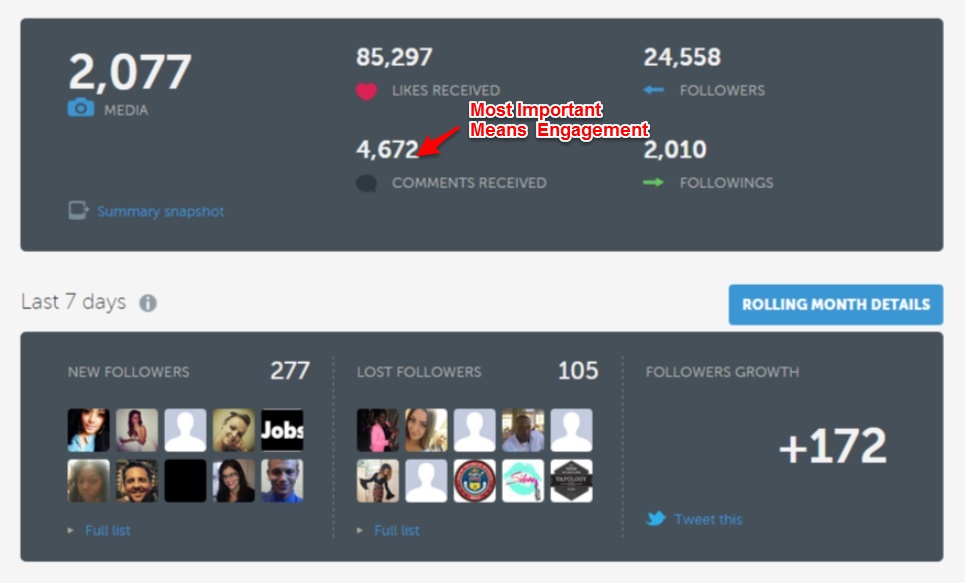
When you first access your Statigram account, you’ll land on your Overview page. This page is exactly that, a quick overview of your account. You can see how many followers you have, how many people you are following, and the total number of likes and comments you’ve received. But you’re gonna want to dig deeper into your analytics than that.
Here are some of the best things I recommend to track on Statigram.
Followers and Followings
From the left menu, click on the “Community” tab to view your followers and followings information.
Here you can see, on a graph, how your community is growing. It’s also broken down into three categories: Followers You Don’t Follow Back, Reciprocal relationships, and Followings Who Don’t Follow You Back. Ideally, you want to have a lot of reciprocal relationships and you want to minimize the number who don’t follow you back. I’m not saying that you should unfollow people who don’t follow you back. We all have plenty of people (celebrities, businesses, favorite igers) who we follow and who don’t follow us back. But if your goal is to foster relationships and build a community on Instagram, you want to connect with people who have an interest in you as well.
At the top of the page where it lists the numbers of each category, you’ll notice there’s a little magnifying glass next to each number. If you click on this magnifying glass, Statigram will show you all of the people from that category. This is an easy way to go through and manage your connections, whether to follow someone new or to unfollow someone.
You can also see your week’s newest followers and your lost followers on this page.
At the bottom of the page you can see the people you follow who you are most active with and how many of your “likes” given were to those you follow or not.
Optimize Your Posts
To determine how your posts are performing or how you can improve them, click on the “Optimization” tab on the left menu.
Here you can see when your audience is most actively engaging with your posts, the average lifespan of your posts, and what hashtags you’re actively using compared with the most popular hashtags on Instagram.
To determine your best posting schedules, analyze the Best Times To Post graph. Your posts times and frequency are represented by black circles outside the graph. Your audience’s engagement is represented by grey circles inside the graph. The larger the circle, the more frequently that time is active. For example, as you can see from my graph, I post most frequently at 6:00 am, 4:00 pm, and 5:00 pm on Tuesday, Thursdays, Fridays, and Saturdays. And my audience is most engaged with my posts at 5:00 pm except on Tuesdays and Wednesdays.
Knowing when your audience is most active is important to your strategy in order to maximize your post results. It’s also worth noting that this information can change frequently. I’ve had peak posting times vary from 4:00 pm to 8:00 pm.
Post Engagement
Click on the “Engagement” tab on the left menu to see your monthly levels of engagement.
The first set of data is related to the likes you receive. The top graph shows you how many total likes your posts receive every month and the average number of likes you receive per post. Depending on your posting frequency and the types of posts you share, you may notice up and down trends in your results. Statigram also shows you your most liked photos of all time.
The second set of data is related to the comments you receive. The graph shows you how many total comments your posts receive every month and the average number of comments you receive per post. You will also be able to see your most commented posts ever. If you want to boost your level of engagement with comments try different methods: including CTAs on the image itself, asking questions in your post caption, polling your audience for answers, and other methods.